Correlation

Correlation is a measure of the similarity in behaviour of two assets. This can be important when considering the diversification, in a portfolio of assets, as a portfolio consisting of assets which all behave in a similar way would result in larger swings in value, with all of the assets rising and falling in unison as market conditions changed.
Correlation is often measured from a value of +1 to -1; +1 indicates perfect correlation, meaning that the two assets will move perfectly in unison in the market. A value of 0, in between the two extremes, would indicate no correlation between the two assets. Finally, a value of -1 would mean that the two assets rise and fall in complete opposition to one another; when one rises, the other falls.
Correlation can also be used as an indication of how similar or different an asset is compared to, for example, its sector, Morningstar Category, or benchmark.
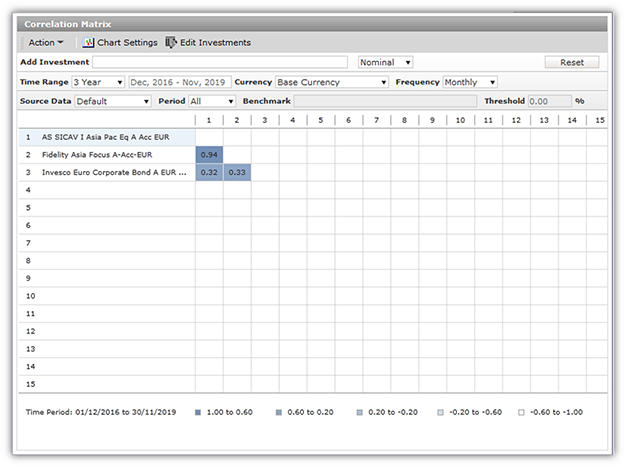
Example of a Correlation Matrix chart
The below example shows the correlation between three investment funds. Whilst fund 1 and 2 are both equity funds investing in shares of companies operating in Asia, the geographical coverage of fund 1 is specific to only Asia-Pacific regions, so the two funds are not entirely correlated but do react similarly in changing market conditions with fund 1 displaying a correlation rate of 0.94 with fund 2.
Fund 3 is a bond fund investing in European corporate bonds so its portfolio of holdings is constructed and managed very differently to fund 1 and 2. A bond fund does not behave in the same way as an equity fund, hence fund 3 has a much lower correlation to the other equity funds of 0.32 against fund 1 and 0.33 against fund 2.
